Compare and contrast are often used to talk about the similarities and differences between two ideas or objects. In simple terms, compare means to see the similarities and contrast mean to see the difference. These two words are very commonly used on respective scenarios.
Graphic organizer diagram types are an easy way to determine comparisons and contrasts. There are 5 types of diagrams that can be used to do this analysis. Let’s find out how we can do our analysis quickly and easily.
1. Compare & Contrast Diagrams
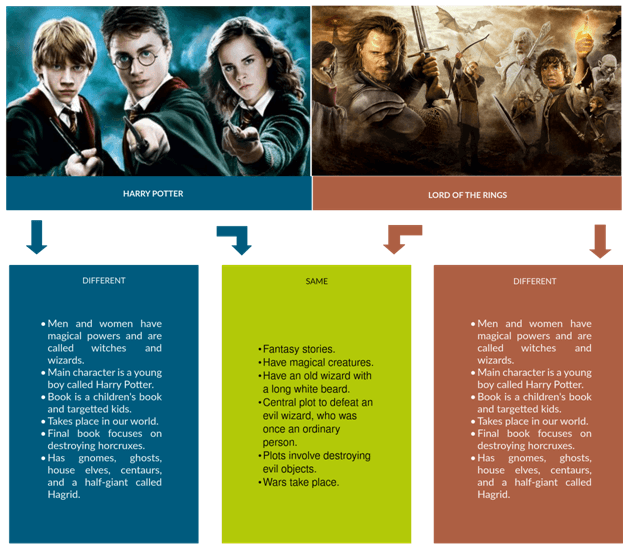
Compare and contrast diagrams are the most reliable way to do comparisons and contrasts. Following diagram is the best example for that.
It compares and contrasts everyone’s two favorites Harry Potter & Lord of the Rings.
As you can see, similarities between both plots are listed down in the middle, while the differences are presented on the sides. This diagram gives a quick overview on the similarities and differences between the two movies. It’s much more effective than mentioning them in detailed paragraphs.
2. Venn Diagrams
Venn diagrams are used to prove the set theory and can be used for compare and contrast analysis as well. The following example is based on a Venn diagram that indicates similarities and differences between online tutoring and face to face tutoring.
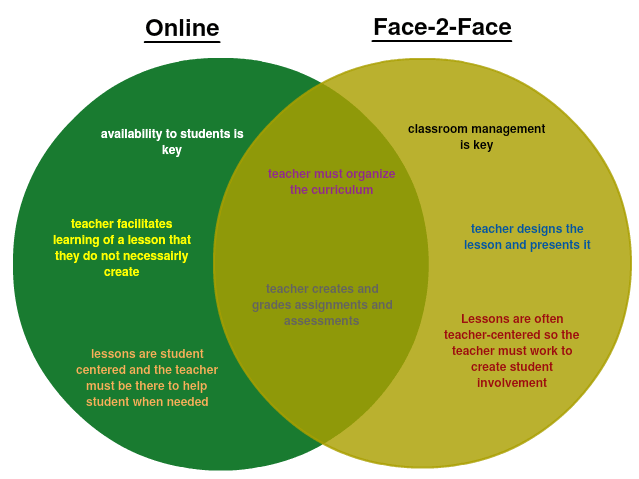
Sides represent the differences and the intersection is where similarities are grouped. This is based on set theory and you can add more circles (sets) to do a 3 way comparison as well.
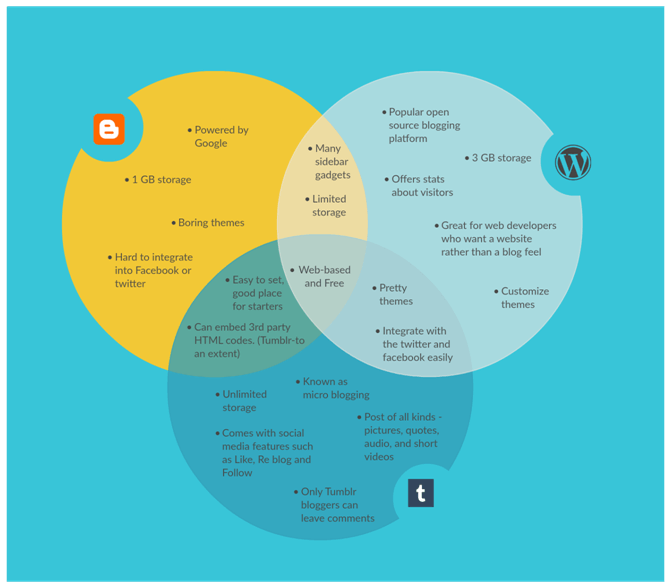
3. Sets, Venn Diagram Example
Following examples illustrate the similarities and differences between 3 major blogging platforms WordPress, Blogger and Tumblr.
Following examples illustrate the similarities and differences between 3 major blogging platforms WordPress, Blogger and Tumblr.
4. SWOT Analysis
SWOT (Strengths, Weaknesses, Opportunities, and Threats) analysis is a comparison done on external entities in order to identify the potential opportunities, threats in the marketplace.
SWOT analysis can be done for companies, businesses as well as individuals when comparing themselves with their competition.
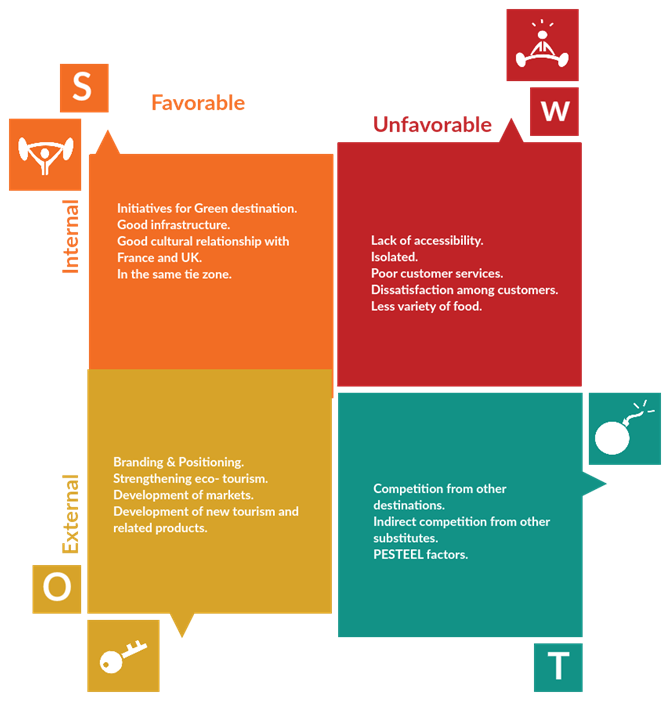
Following example is a SWOT analysis done for the tourism industry comparing it with other industry with the information below.
- Strengths – Current strengths in the tourism industry compared to other industries.
- Weaknesses – The weaknesses the industry is facing compared to other industries.
- Opportunities – Opportunities that may arise in the future.
- Threats – Potential threats that could affect the industry in the future.
5. KWL Charts
KWL Charts also know as “What I Know”Charts or Know-Wonder-Learn charts are a type of graphic organizer that helps students organize what they know and what they want to learn about a topic before and after conducting a research. This chart is mainly a comparison among what you know, what you need to know and what you should learn.
This helps in reviewing what has been learned about the material, helps obtain more information, and readies the student to write about what they’ve learned.
- K stands for what you already KNOW about the subject.
- W stands for what you WANT to learn.
- L stands for what you LEARN as you read.
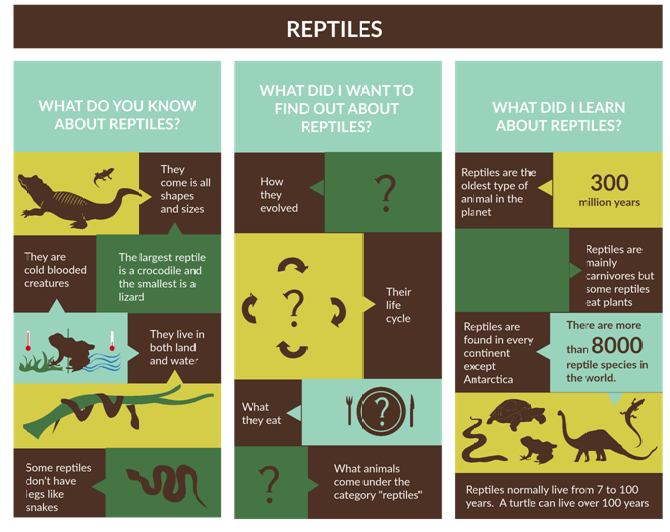
The following comparison is about the reptiles. It compares one’s knowledge based on his understanding about reptiles, what he doesn’t know about reptiles and what is actually meant for learning.
6. Infographics
Infographics are another promising way to do visual comparisons. A combination of graphics and texts, infographics can be used as a technique to compare and contrast facts in an appealing manner.
Since there is no proper template, you can use your own graphics to represent and compare whatever you need. It’s more about data visualization; hence it’s better to include more graphics and fewer texts.
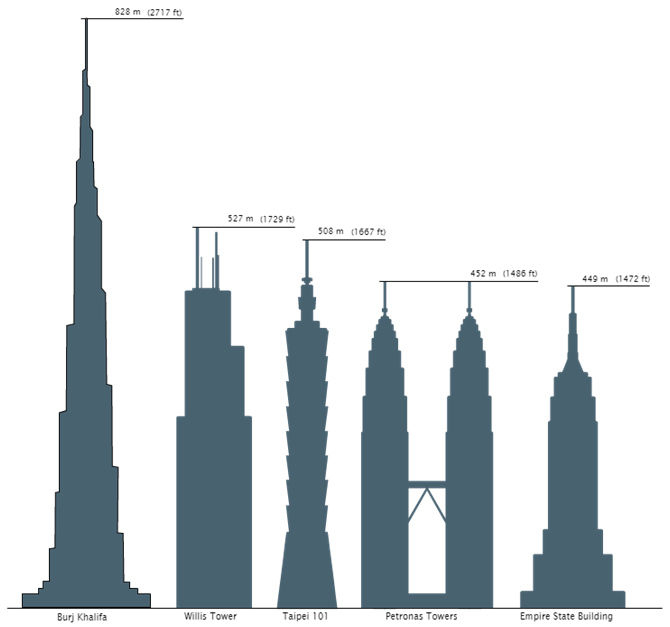
The following example is based on a comparison done on skyscrapers in the Asia Pacific region. As you can see, the towers are compared with each other and the differences are effectively illustrated. Facts are there just to support the viewpoint.
You can find these examples in Creately Diagram Community. Do your next comparison and contrast with these diagrams easily and quickly. And let us know your experience in the comment section.